Navigate to...
Health Inequities Abound: California Health Interview Survey Data Release
Differences in race and ethnicity, income level, and sexual orientation and gender identity continued to be linked to differences in equitable experiences across a range of health-related issues affecting Californians, according to the UCLA Center for Health Policy Research’s latest California Health Interview Survey (CHIS).
What's New
536 total variables/topics
are included in the AskCHIS™ system for 2023
19 million
different CHIS estimates can be explored in AskCHIS™
1,493 detailed variables
for research in the CHIS 2023 Public Use Files
Some of the 2023 findings include:
Housing discrimination
Among adults, 4.6% said they experienced housing discrimination in the last two years.
Gambling
About 25% of California adults said they gambled in the past year, and of those individuals, 6.7% reported they had symptoms of problem gambling.
Police stops
While the percentages for all California adults who were stopped by police in the last year decreased from 20% in 2022 to 16.8% in 2023, the percentages for Black or African American adults increased from 26.7% to 30.2%.
Voter engagement
65.7% of those with stable housing said they were always or frequently engaged in national, state, and local elections, compared with 48.8% of those without stable housing.
Adolescent sexual orientation
Among adolescents, 13.3% said they were gay, lesbian, bisexual, pansexual, or they used a different term, compared with 9.3% of adults.
Mental health concerns
For Asian adults, rates of serious psychological distress (SPD) remain above pre-pandemic levels (9.7% in 2019, peaking at 14.5% in 2021, and 12.8% in 2023).
Food insecurity
Almost half (44.5%) of California adults earning less than 200% of the federal poverty level in 2023 reported being unable to afford enough food. This figure has increased every year since 2020, when it was 35.8%.
Medical debt
More than half of adults who had problems paying their medical bills in the past year reported incurring credit card debt to pay their medical expenses. This percentage has grown from 45.2% in 2020 to 56.3% in 2023.
These new topics provide policymakers, researchers, journalists, community advocates, and the public additional verified data to help them better understand the challenges facing California’s diverse population.
Watch the CHIS Data Release
CHIS 2023 Methodology Reports and Papers
Sample design, data collection methods, data processing and editing procedures, response rates, and weighting and variance estimation.
Explore the five methodology reports for the 2023 CHIS:
Report 1: 2023 Sample Design — describes the procedures used to design and select the sample for CHIS 2023, including why the design features were selected and alternatives that were considered. The report also provides information about the sampling methods used for both the household and person (within household) sampling and a discussion on achieved sample size and how it compares to the planned sample size.
Report 2: 2023 Data Collection Methods — describes the protocols followed to contact sampled addresses and how data were collected for CHIS 2023, including procedures to complete the child and adolescent extended interviews and outcomes of sampled addresses and quality control measures.
Report 3: 2023 Data Processing Procedures — describes the data processing and editing procedures for CHIS 2023, including detailing the data editing procedures and addressing the steps taken for ensuring data quality, delivery of the final data sets, information about geographic coding, how the race and ethnicity survey items were coded for CHIS,
Report 4: 2023 Response Rates — provides analysts with information about the response rates in CHIS 2023 and examines procedures used in the survey to improve response rates.
Report 5: 2023 Weighting and Variance Estimation — describes the weighting and variance estimation methods from CHIS 2023, including the steps used to create the analytical weights for analyzing the data from the adult, child, and adolescent interviews. The purpose of weighting the survey data is to permit analysts to produce estimates of the health characteristics for the entire California population and subgroups including counties and, in some cases, cities.
Read more on CHIS Methodology...
An Experimental Evaluation of Methods for Converting Partial Interviews to Completes in an Address-Based Sample Survey Push-to-web surveys have emerged as a promising data collection method over the last decade. However, breakoffs are a prevalent issue in the web mode that leads to incomplete data and potential bias in key survey estimates. This paper shares methods for converting partial interviews into completes.
Can FedEx Mailings Improve Response from Black or African American Californians in an Address-Based Sample Survey? An Experiment in the California Health Interview Survey In an effort to increase participation among Black and African American Californians, CHIS conducted an experiment in 2023 to explore enhancements to its existing mail methods in high density Black and African American census tracts, specifically testing the effects of using FedEx mailings for nonresponse follow-up. This paper shares whether FedEx mail affects response rates, respondent representativeness, and survey costs.
Read more on CHIS Methodology...
CHIS By the Numbers
22,480
households interviewed (21,671 adults, 968 adolescents, 3,377 children)
89%
of interviews completed by web
536
total variables/topics are included in the AskCHIS™ system for 2023
6 languages
CHIS is conducted in six languages: English, Spanish, Chinese (Mandarin and Cantonese), Korean, Vietnamese, and Tagalog.
8%
of adult interviews completed in a language other than English
11%
of interviews completed by phone
CHIS Data Tools
AskCHIS™
AskCHIS™ was updated in October 2024 with the full 2023 CHIS data.
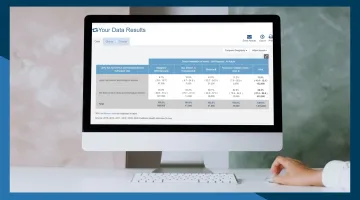
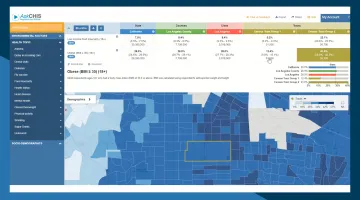
As CHIS' most comprehensive tool, AskCHIS™ draws upon the responses of 20,000+ California households interviewed each year and provides data on a wide range of health topics across many sociodemographic factors. Users are able to quickly search for health statistics by county, region, and state.
Currently, there are approximately 19 million different CHIS estimates that can be explored in AskCHIS™.
AskCHIS™ By the Numbers
87,202
queries run in AskCHIS™ in 2024
1,884,543
queries run in AskCHIS™ since inception
5,901
total AskCHIS™ users in 2024
AskCHIS™ NE
This year, CHIS launched the new AskCHIS™ NE in Tableau, featuring a revamped look and feel, and adding new 2021–2022 CHIS data.
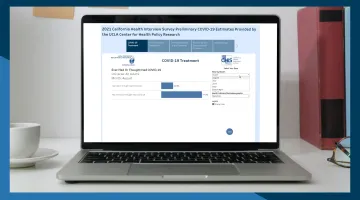
AskCHIS™ NE provides data on select health topics: chronic conditions such as asthma and diabetes, delays in receiving medical care, health and mental health status, physical activity, food insecurity, and more. The updated application still supports the same geographies — census tracts, ZIP codes, legislative districts, cities, and counties. Updates to the application were made to support updated geographic boundaries for the new 2022 small area estimates. Video tutorials are also available to help guide users on how to create tables and maps.
AskCHIS™ NE By the Numbers
14,997
queries run in AskCHIS™ NE in 2023
72,281
queries run in AskCHIS™ NE since inception
2,314
total AskCHIS™ NE users
Public Use Files (PUF)
In 2024, CHIS released several new Public Use Files (PUFs):
2023 One-Year PUF
One-year PUFs consist of individual records obtained from each survey year (CHIS 2001–2023), contain comprehensive data on a large range of topics at the state level, and include variables that minimize the risk of indirect identification of CHIS respondents.
2023 Long-Term Services and Supports (LTSS) PUF
CHIS has introduced a new 2023 PUF for the Long-Term Services and Supports (LTSS) Study, which contains a set of questions assessing experiences of Californians who have difficulties with certain activities of daily life, such as dressing, bathing, walking, or doing errands.
2021–2022 Two-Year Cycle PUFs
Unlike the single-year PUFs, two-year PUFs have additional variables and more detailed indicators such as race and ethnicity variables in groups that otherwise may have smaller sample sizes (i.e., American Indian and Alaska Native, Native Hawaiian and Pacific Islander, and other racial and ethnic subgroups).
“The larger samples in the two-year Public Use Files enable researchers and other CHIS users to look at more granular data on racial and ethnic subgroups. A core focus of the UCLA Center for Health Policy Research is understanding inequities in health and the social drivers of health on communities that are often hidden by combined or aggregated data,” said Ninez A. Ponce, PhD, MPP, director of the UCLA CHPR and principal investigator of CHIS. “Looking at more-detailed data allows stakeholders to look at health indicators and tailor support or outreach to groups who need help.”
CHIS PUFs provide researchers and other data users with comprehensive statewide CHIS data files to customize and run their own data analyses, with files available in a variety of data formats — SAS and Stata. PUFs are also available in adult, teen, and child age groups, and are free and accessible to anyone via a brief application.
PUFs include:
- Microdata files with individual respondents in rows and variables in columns.
- Hundreds of variables covering health status, health conditions, health-related behaviors, health care access, health insurance coverage information, and detailed demographic information including gender, age, race and ethnicity, urban/rural, and other descriptors.
Learn more about Public Use Files (PUFs)...
Health Profiles
Health Profiles provide quick and easy access to the most commonly requested health indicators from the CHIS. The simple dashboards present data on demographics, health care access and utilization, health behaviors, health outcomes, and other factors by geography: county, region, Los Angeles Service Planning Area (SPA), and San Diego Health and Human Service Agency region. Health Profiles can be downloaded in both PDF and CSV formats.
Both the Adult Health Profiles and Race and Ethnicity Health Profiles were updated in 2024 with 2021–2022 CHIS data.
Learn more about Health Profiles...

Featured News
UCLA Center for Health Policy Research honored with Inclusive Voices Award
The Center’s California Health Interview Survey receives national recognition for work highlighting understudied populations.

Featured News
Ninez A. Ponce receives 2024 Elizabeth Fries Health Education Award for trailblazing work in health and data equity
The director of the UCLA Center for Health Policy Research was honored by the CDC Foundation and the James F. and Sarah T. Fries Foundation.

Featured News
UCLA Center for Health Policy Research commends revised federal data collection standards
Researchers tout benefits of more representative data about race, ethnicity and identity, while monitoring how changes will be implemented.
Featured Op-ed
Erase ‘other’: Accurate Census data matters for every American
In an op-ed in The Hill, Ninez A. Ponce, PhD, MPP, director of the UCLA Center for Health Policy Research, wrote about how having the right public health data helps policymakers pinpoint the needs of specific communities, allocate resources more appropriately, and develop more effective solutions.


