From census tracts to ZIP codes, AskCHIS™ Neighborhood Edition goes granular.
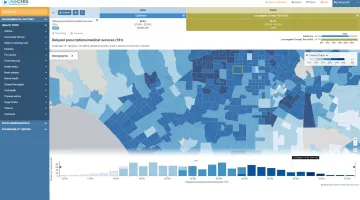
AskCHIS™ Neighborhood Edition (NE) is an online data dissemination and visualization platform that provides health estimates at sub-county geographic regions: census tract, ZIP code, city, county, and legislative district levels.
Using a sophisticated modeling technique called Small Area Estimation (SAE), AskCHIS™ NE provides local health departments, policymakers, legislators, community organizations, researchers, and other stakeholders the data needed to target health interventions based on a neighborhood’s specific needs.
Ready to get started?
Please create new login credentials to access the dashboard. If you have already created new login credentials for our website, then you will use the same username and password. The credentials that you used to log into the old AskCHIS™ NE dashboard will not work.
- Asthma (2012, 2014, 2016, 2018, 2020, 2022)
- Delays in receiving care (2012, 2014, 2016, 2018, 2020, 2022)
- Diabetes (2012, 2014, 2016, 2018, 2020, 2022)
- Food insecurity (2012, 2014, 2016, 2018, 2020, 2022)
- Health status (2012, 2014, 2016, 2018, 2020, 2022)
- Heart disease (2012, 2014, 2016, 2018, 2020, 2022)
- Mental health (2012, 2014, 2016, 2018, 2020, 2022)
- Obesity/overweight (2012, 2014, 2016, 2018, 2020, 2022)
- Oral health (2012, 2014, 2016, 2018, 2020, 2022)
- Sugar drinks (2014, 2016, 2020, 2022)
- Tobacco (2012, 2014, 2016, 2018, 2020, 2022)
- Uninsurance (2012, 2014, 2016, 2018, 2020, 2022)
Data is also available on the following topics and years: community service (2018), flu vaccine (2012, 2014, 2016), life expectancy (2016), and physical activity (2012, 2014, 2016).
Data can be viewed by sociodemographic factors including: racial and ethnic group, age, gender, language, education, poverty level, citizenship, and more.
Through AskCHIS™ NE’s easy-to-use data visualization tools and intuitive interface, users have the power to:
Visualize
Create, export, and share maps, charts, and histograms.
Narrow
Compare key health indicators at the hyper-local level: including census tract, legislative district, ZIP code, city and county.
Combine
Combine locations to build health estimates for custom geographies.
AskCHIS™ NE newer features:
Preexisting Health Vulnerability Index
captures risk of COVID-19 infection and death due to preexisting health conditions. This index comprises six different 2016 AskCHIS™ NE variables: adult diabetes, obesity, heart disease, health status, psychological distress, and food insecurity.

Area Deprivation Index
based on a measure created by the Health Resources and Services Administration (HRSA). It allows for rankings of neighborhoods by socioeconomic disadvantage in a region of interest.

Social Vulnerability Index
created for the Centers for Disease Control and Prevention (CDC) to help public health officials and emergency response planners identify and map communities that will most likely need support before, during, and after a hazardous event.
Healthy Places Index
created for the Public Health Alliance of Southern California. This index combines 25 community characteristics into a single indexed score.
CalEnviroScreen
identifies California communities by census tract that are disproportionately burdened by, and vulnerable to, multiple sources of pollution. Factors include children’s lead risk from housing, drinking water contaminant, ozone ratio, particulate matter, pesticide use, and pollution burden.

AskCHIS™ NE Application Programming Interface (API)
gives web developers, programmers, and data analysts on-demand access to the most current, authoritative, health information from AskCHIS™ NE. For a web developer, this means programmatic access to estimates essential for data portals, visualizations, and clinical applications. For data analysts, it means bringing granular health information directly into statistical software that can be merged with outside data for a more layered research and analysis.
AskCHIS™ NE at a Glance
48,000+
queries made in AskCHIS™ NE since its inception
83,000+
queries made in AskCHIS in 2022
2,500+
AskCHIS users


